PNG Maps API
Please note that this product is reaching its end-of-life phase, and therefore won't be developed further anymore. Its successor is the maps API, which is based on our new Weather Maps and much more advanced technology.
API URL
Note that the best way to configure your map is using the developer tool link on the meteoblue weather map page, rather than creating an URL by hand.
To see the weather map API in action, go to the meteoblue website:
https://www.meteoblue.com/en/weather/webmap/
On the bottom-right of the page, you will find the developer tool under Settings -> Show developer info, which gives you the URL of the map displayed on the screen, making configuring your own map very easy.
Parameters
Example API-URL:
The following list shows the structure of the API-URL:
https://my.meteoblue.com/visimage/webmap? is the base address for weather maps API.
Mandatory Settings:
| Parameter | Description | Example |
|---|---|---|
| apikey | your personal API key | &apikey=DEMOKEY |
| variable | weather maps layers (see chapter Weather maps layers) | &variable=temperature_pressure |
| time | date and time in UTC – yyyymmddhh | &time=2017022115 |
| imgxs | upper limit of horizontal pixel size* | &imgxs=963 |
| imgys | upper limit of vertical pixel size* | &imgys=800 |
| latmin | minimum latitude coordinate in WGS84 (>-77) | &latmin=45.3024 |
| latmax | maximum latitude coordinate in WGS84 (<77) | &latmax=49.7213 |
| lonmin | minimum longitude coordinate in WGS84 (>-180) | &lonmin=22.79 |
| lonmax | maximum latitude coordinate in WGS84 (<180) | &lonmax=12.8632 |
* The image size is an upper limit, actual images will be somewhat smaller because the api makes sure that the geographical region, specified by latmin, latmax, lonmin, lonmax is exactly met. Note that the delivered image size will be 3'000 x 3'000 pixels at most.
Optional Settings
| Parameter | Description | Example | Default |
|---|---|---|---|
| level | height level (see chapter Height levels) | &level=surface | surface |
| countryoverlay | show country boarders, 1=yes, 0=no | &countryoverlay=1 | 0 |
| timestamp | show the timestamp and resolution of the underlying model, 1=yes, 0=no | ×tamp=1 | 1 |
| colorbar=1 | height level colorbar on map, 1=yes, 0=no | &colorbar=1 | 0 |
| webmercator | if set to 1, the latmin,latmax,lonmin,lonmax coordinates can be specified in WEB-mercator metric coordinates (EPSG:900913 or EPSG:3857) | &webmercator=1 | 0 |
Special Settings
Transparent Pressure Lines
variable=none_pressure will give a transparent image with only the pressure lines.
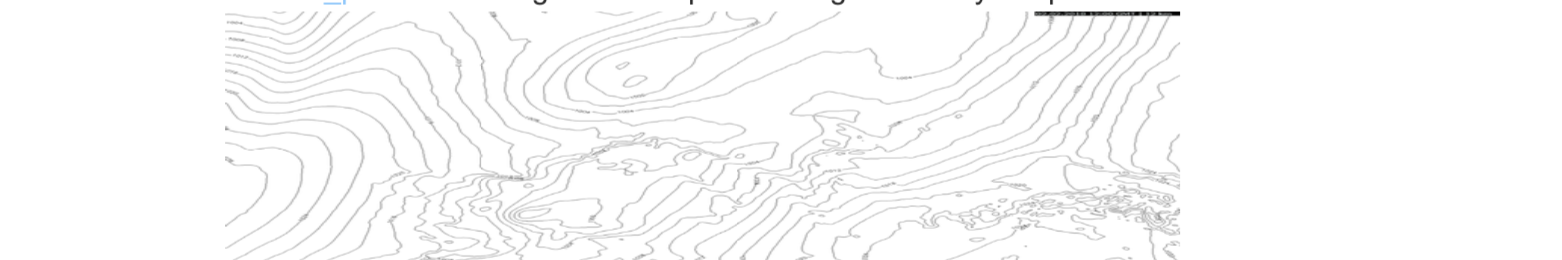
Do not combine variable=none_pressure with colorbar=1.
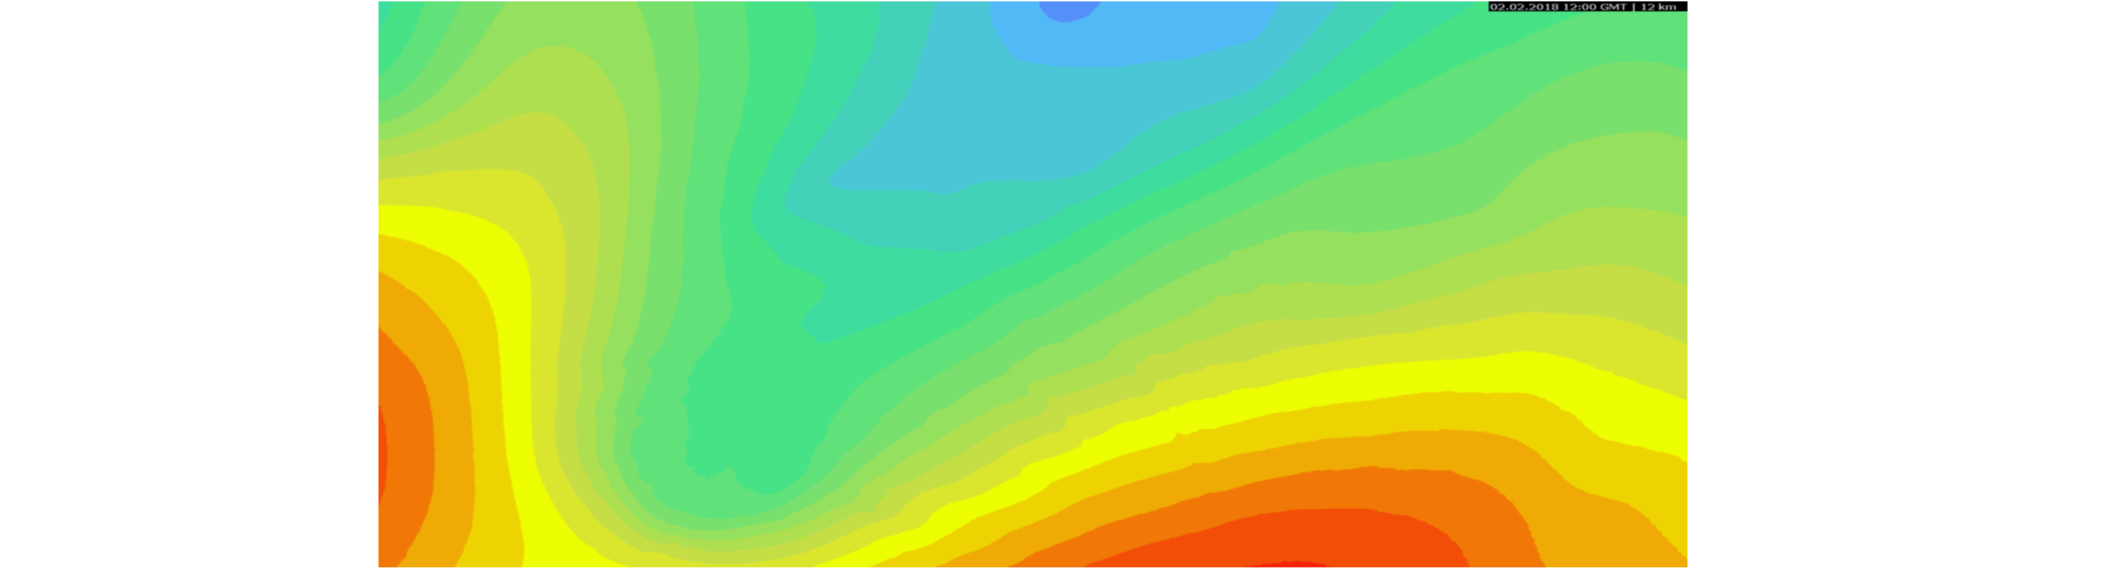
Transparent Temperature Overlay
&variable=temperature Will give a transparent image with only the temperature overlay:
Combinations
Each map layer can be combined with a line overlay by adding an underscore.
Examples:
- Temperature and streamlines: &variable=temperature_streamlines
- Temperature and pressure lines: &variable=temperature_pressure
- Wind speed and wind direction: &variable=wind_arrows
- All possible combinations can be checked on the meteoblue website: https://www.meteoblue.com/en/weather/webmap/
Image Formats
- All maps are delivered as lossless 8 bit colour PNG image.
- The maps can be overlayed with any web-mapping service (Google maps, OSM, etc) using the web-mercator projection (EPSG:900913 or EPSG:3857)
- The maps are optimized to be overlayed on a map background (Google maps, OSM, etc). A good value of transparency to use for the weather map is around 60%. Some maps, (where appropriate e.g. precipitation, dust, air quality index, probabilities, clouds or maps featuring ocean forecasts) have full transparency in certain parts.
- Image size: the image size can be specified only approximately. The values for imgxs (horizont- al direction) and imgys (vertical direction) represent the upper limits of the size, so images are typically somewhat smaller than this upper bounds. The reason is that the maps are generated to meet the exact geographical region specified by latmin,latmax,lonmin,lonmax, which is required to allow for a perfect overlay with the background maps. You should use a image size which is close to the one used in final display. As such if you zoom in or out of a map it is recommended to call a new map for the new geographical region in the requested image size. The reason is that maps containing line overlays e.g. pressure or wind arrows are optimized in size to be well readable at the requested pixel size. Furthermore, when zooming in, the content to some degree will show more detail or even use a different higher resolution weather model, where available. Note that weather models have a spatial resolution of 4 to 30 km, therefore it is not useful to zoom in to regions covering only a few kilometres as the underlying information will not improve beyond the resolution limit. The resolution of the model used on a particular map can be displayed using ×tamp=1 in the URL.
Calls
Number of Calls
The number of calls that you need is depending on the number of updates, days and layers, as well as if you want to allow users to truly interact with the map, rather than showing a static geographical region.
Example:
- 24 images (hourly data) for 6 days for one layer with 2 daily updates = 24 x 6 x 2 = 288 calls per day
- 24 images (hourly data) for 6 days for three layers with 2 daily updates = 24 x 6 x 3 = 432 calls per day
If you want to zoom and pan the map arbitrarily you will need likely thousands of calls as every zoom and pan operation ideally would trigger a new API call to achieve the best result, in this case you should contact us for special pricing.
Calls per Minute
Without further agreements we impose a rate limit of 100 calls per minute.
Maximum calls per minute with daily calls >144'000: allowed are 0.1% of the daily calls
Example:
150'000 daily calls = max. 150 calls/minute 500'000 daily calls = max. 500 calls/minute 1'000'000 daily calls = max. 1'000 calls/minute
If the calls per minute limit is exceeded, meteoblue does not guarantee the immediate delivery of the requested data. Calls may be either significantly delayed or denied.
Weather Map Layers
The following tables will list all avalable options a user has for the URL-Paramter variable.
Temperature
| Variable | Parameter Value | Comment |
|---|---|---|
| Temperature | temperature | |
| Max temperature (last 12 h) | tmax12 | |
| Min temperature (last 12 h) | tmin12 | |
| Max temperature (last 24 h) | tmax24 | |
| Min temperature (last 24 h) | tmin24 | |
| Max temperature (last 48 h) | tmax48 | |
| Min temperature (last 48 h) | tmin48 | |
| Max temperature (last 72 h) | tmax72 | |
| Min temperature (last 72 h) | tmin72 | |
| Temperature amplitude (last 24 h) | tmmp24 | |
| Temperature change (last 24 h) | tmch24 | |
| Equivalent potential | thetae | |
| Wet-bulb potential | thetaw | |
| Dew point | dewpoint | |
| Dew point deficit | dewdef |
Clouds
| Variable | Parameter Value | Comment |
|---|---|---|
| Cloud cover | cloudcover | |
| Convective clouds vertical extent (hPa) | convectiveclouds | |
| Convective cloud base (m asl.) | convectivecloudbot | |
| Convective cloud top (hPa) | convectivecloudup | |
| Cloud base height | cloudbase | |
| Cloud top height | cloudtop |
Waves
| Variable | Parameter Value | Description |
|---|---|---|
| Swell height | waveswellht | |
| Swell period | swellwaveperiod | |
| Wind wave period | wwaveperiod | |
| Wind wave height | wwavehg | |
| Significant wave height | waveht | |
| Wave height/direction | waveht_primarywavedirection |
Precipitation
| Variable | Parameter Value | Comment |
|---|---|---|
| Precipitation 1-hour and clouds | precipitation01_cloudcover | |
| Precipitation 3-hour and clouds | precipitation03_cloudcover | |
| Precipitation 1-hour | precipitation01 | |
| Precipitation 2-hour | precipitation02 | |
| Precipitation 3-hour | precipitation03 | |
| Precipitation 6-hour | precipitation06 | |
| Precipitation 12-hour | precipitation12 | |
| Precipitation 24-hour | precipitation24 | |
| Precipitation 48-hour | precipitation48 | |
| Precipitation 72-hour | precipitation72 | |
| Snow fall (last 1 h) | precipitation01_snowfall | |
| Snow fall (last 3 h) | precipitation03_snowfall | |
| Snow fall (last 12 h) | precipitation12_snowfall | |
| Snow fall (last 24 h) | precipitation24_snowfall | |
| Snow fall (last 48 h) | precipitation48_snowfall | |
| Snow fall (last 72 h) | precipitation72_snowfall | |
| Estimated snow depth | snowdepth | |
| Precipitation probability >0.1mm | pcpprob01 |
Wind
| Variable | Parameter Value | Comment |
|---|---|---|
| Wind speed | wind | |
| Wind (low speeds) | windlowscale | |
| Wind (detail) | wind_isotach_arrows | |
| Wind gust | gust |
Air Quality
| Variable | Parameter Value | Comment |
|---|---|---|
| Grass pollen | cams_pollen_grass_barbs | Europe only |
| Birch pollen | cams_pollen_birch_barbs | Europe only |
| Olive pollen | cams_pollen_olive_barbs | Europe only |
| Desert dust concentration | cams_dustsfc | |
| Ozone concentration | cams_ozonesfc | |
| Ozone concentration (Europe) | cams_ozonesfc_europe | Europe only |
| Aerosol optical depth (total) at 550nm | cams_aod550 | |
| Air quality index (CAQI) | cams_aqindex | |
| SO | cams_so2 | |
| SO Europe | cams_so2_europe | Europe only |
| PM10 | cams_pm10 | |
| PM10 (Europe) | cams_pm10_europe | Europe only |
| PM2.5 | cams_pm25 | |
| PM2.5 (Europe) | cams_pm25_europe | Europe only |
| Carbon monoxide (Europe) | cams_comono_europe | Europe only |
| NO | cams_no2 | |
| NO(Europe) | cams_no2_europe | Europe only |
Within Europe, the resolution of the forecast is 12 km, which is very high for air quality purposes, however the forecast cannot capture local effects like pollution along a road in a city, where actual concentrations could be much higher. In such a case you should refer to very local measurements taken at the exact spot of interest.
Others
| Variable | Parameter Value | Comment |
|---|---|---|
| Relative Humidity | rh | |
| CAPE / Lifted Index | cape_liftind | |
| Risk (last 24h) | risk24 | |
| 500 hPa Vorticity/Height | vorticity_gph&level=500mb | |
| 1000-500 hPa Thickness in mm | thickness_pressure&level=500mb | |
| 500 hPa Height/Pressure | height_pressure&level=500mb | |
| 850 hPa Temperature/Height | temperature_gph&level=850mb | |
| 250 hPa Wind (Jet Stream) | wind_streamlines_&level=250mb |
Lines
Lines are overlays that can be plotted over the layers. There are many lines available like streamlines or pressure lines.
| Variable | Parameter Value | Comment |
|---|---|---|
| Streamlines | streamlines | |
| Pressure (sea level) | pressure | |
| Wind speed | isotach | |
| Arrow | arrows | |
| Temperature | tmp | |
| Relative humidity | relhum | |
| Geo potential height | gph | |
| Freezing level height | freezinglvl | |
| Wind wave direction | wwavedirection | |
| Primary wave direction | primarywavedirection | |
| Lifted Index | liftind | |
| K-Index | lkind | |
| Soaring Index | lsoar | |
| Dew point | ldewp | |
| Equivalent potential temp | lthete | |
| Wet-bulb potential temp | lthetw | |
| Vorticity | lvort |
Height Levels
meteoblue weather maps are offered for different height levels.
Some variables can only be combined with specific height levels. To check which height level is available for which layer, please check on the meteoblue website.
Surface Height
| Variable | Parameter Value | Comment |
|---|---|---|
| Surface | surface | 2m / 10m above ground |
Heights in mb, hPa and km
| Height in mb | Height in hPa | Height in km | Parameter Value |
|---|---|---|---|
| 950 | 950 | 0.5 | 950mb |
| 900 | 900 | 1.0 | 900mb |
| 850 | 850 | 1.5 | 850mb |
| 800 | 800 | 2.0 | 800mb |
| 700 | 700 | 3.0 | 700mb |
| 600 | 600 | 4.2 | 600mb |
| 500 | 500 | 5.5 | 500mb |
| 400 | 400 | 7.2 | 400mb |
| 350 | 350 | 8.1 | 350mb |
| 350 | 350 | 9.2 | 300mb |
| 250 | 250 | 10.4 | 250mb |
| 200 | 200 | 11.8 | 200mb |